


Client: Ingenuity is a national leader in arts data collection and mapping. Their work increases arts education access, equity, and quality in Chicago Public Schools.
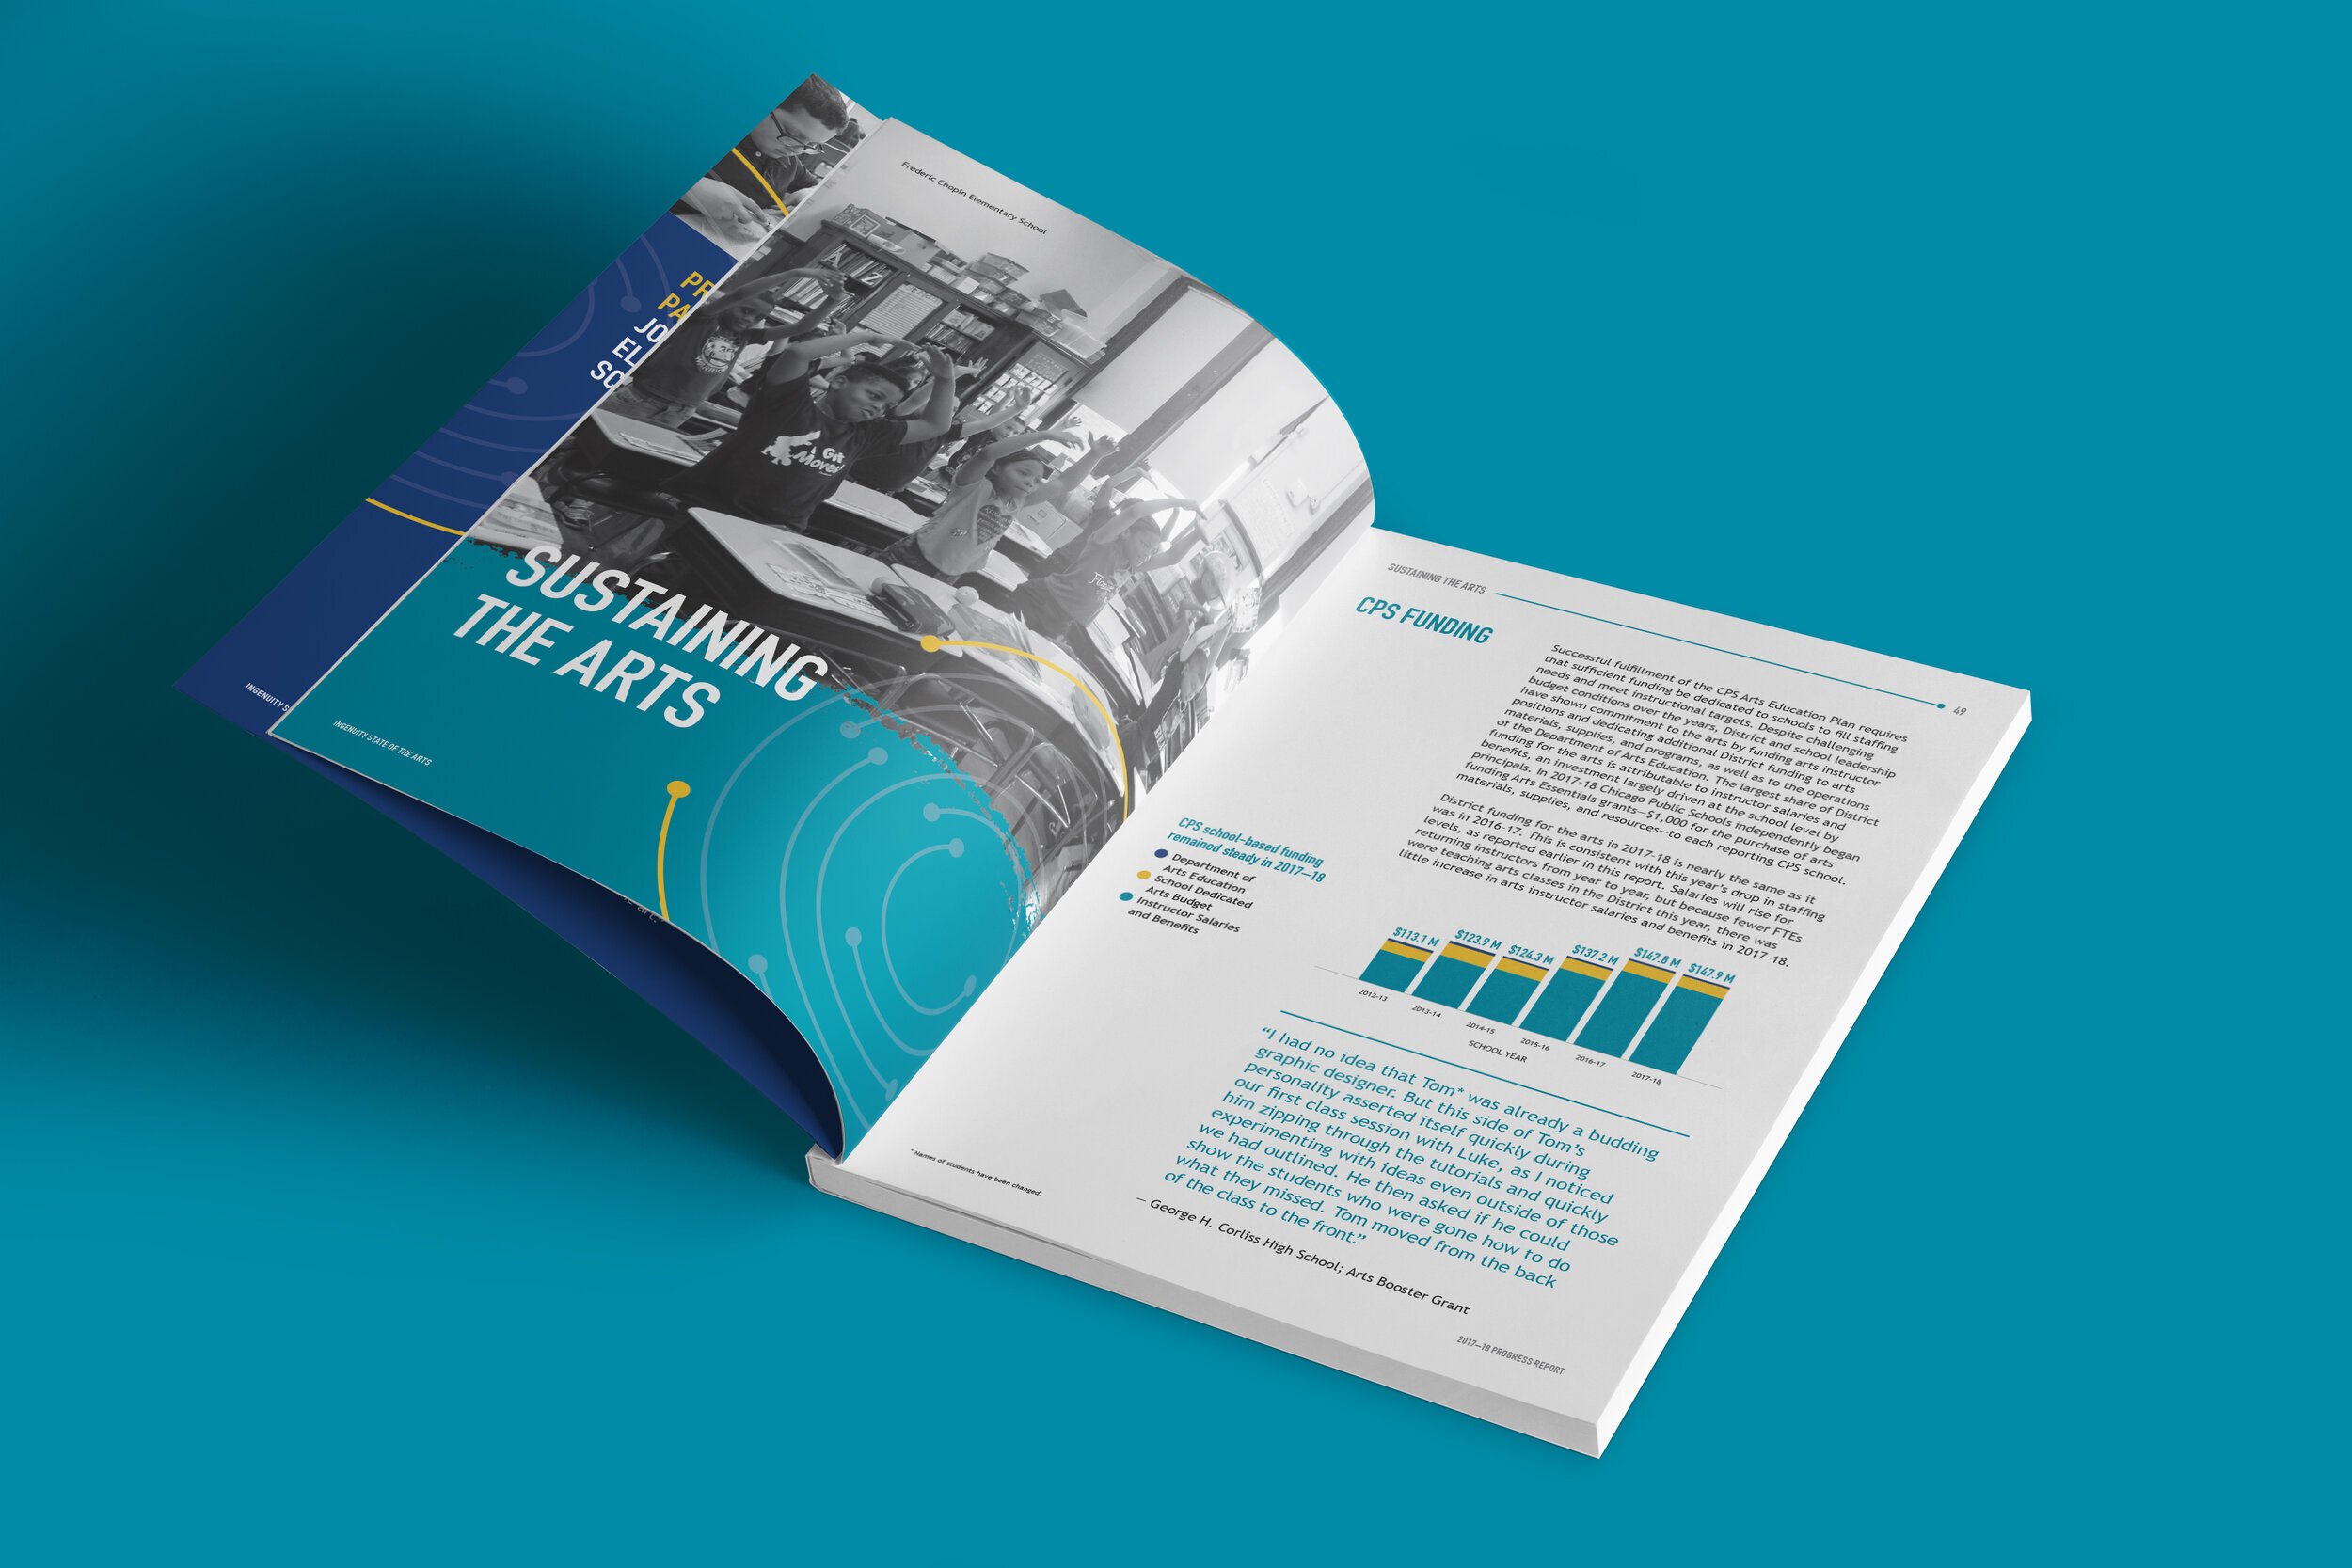
The State of the Arts (SOTA) report outlines the collective progress made during the school year toward ensuring all 350,000 students in Chicago Public Schools (CPS) have access to high-quality arts education. The data for SOTA comes from the Creative Schools Survey, CPS data, and arts partners, as well as charter and options schools. The report reflects staffing, access, instructional time, funding, and arts partnerships.
Client challenge: Communicate a large amount of data in an engaging, easily digestible format.
Services: Annual Report Design + Brand Expression + Brochure Design + Infographics + Social Media
Industry: Arts / Education
Our approach: A kaleidoscope graphic symbolized Ingenuity’s mission. Just as a kaleidoscope reflects bits of colored glass into a sophisticated pattern, Ingenuity’s metrics provide a larger picture of the state of the arts within Chicago Public Schools.
Our approach: Circular graphics were used throughout the piece, including the data interpretation, as a subtle nod to a steering wheel and an embodiment of Ingenuity’s mission to “drive” change. By blending organic brushstroke design elements with photography, the collateral emphasized the important role art plays in every student’s educational journey.
Our approach: The waveform graphic constructed of dots was symbolic of the voices that keep the conversation going for consistent progress. The dots were representative of all the collected data.